TSAP™
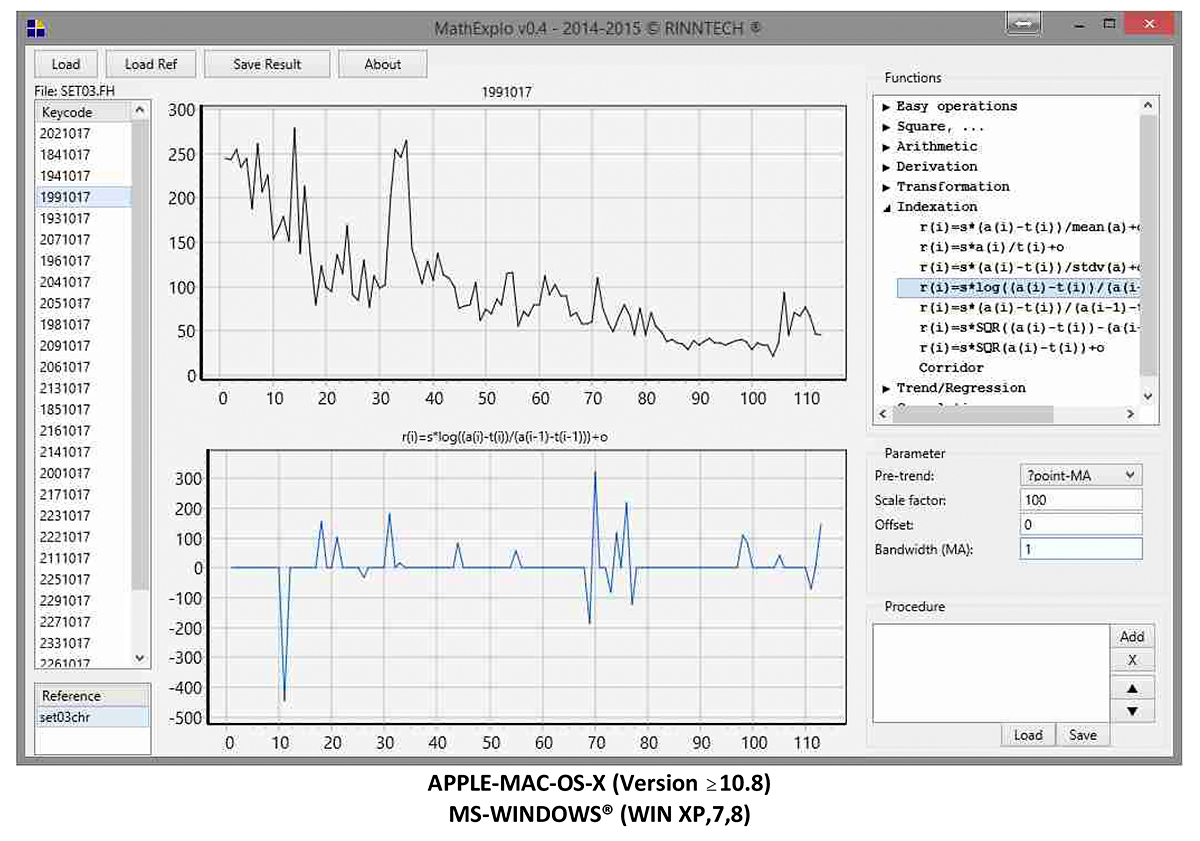 For analysis of data (climate, treerings, greysale, resistance-drilling, density) various mathematical functions are commonly used. For trend elimination, filtering, or indexation, in addition, several different kinds of methods and parameter settings lead to correspondingly different results. MFT enables the user to instantly visually check the results of various mathematical methods and parameter settings on hundreds of data records. The left window shows the stack of input data (selection by KeyCode). The top graph displays the original data series, the right window lists the mathematical functions and parameter. The bottom graph shows the resulting data (that can be saved) instantly after selecting KeyCode (photo, left), method and parameters (photo, right).
- Data in FH-format (ASCII)
- Input: method, parameter
- Output: (transformed) series
- RINNTECH®-clients, students, research and education institutions get a discount